Tutorial on Application of Manifold GIS Software for Precision
Agriculture
Lesson 2 -
3D Display of
Integrated Publicly Available Data
Background
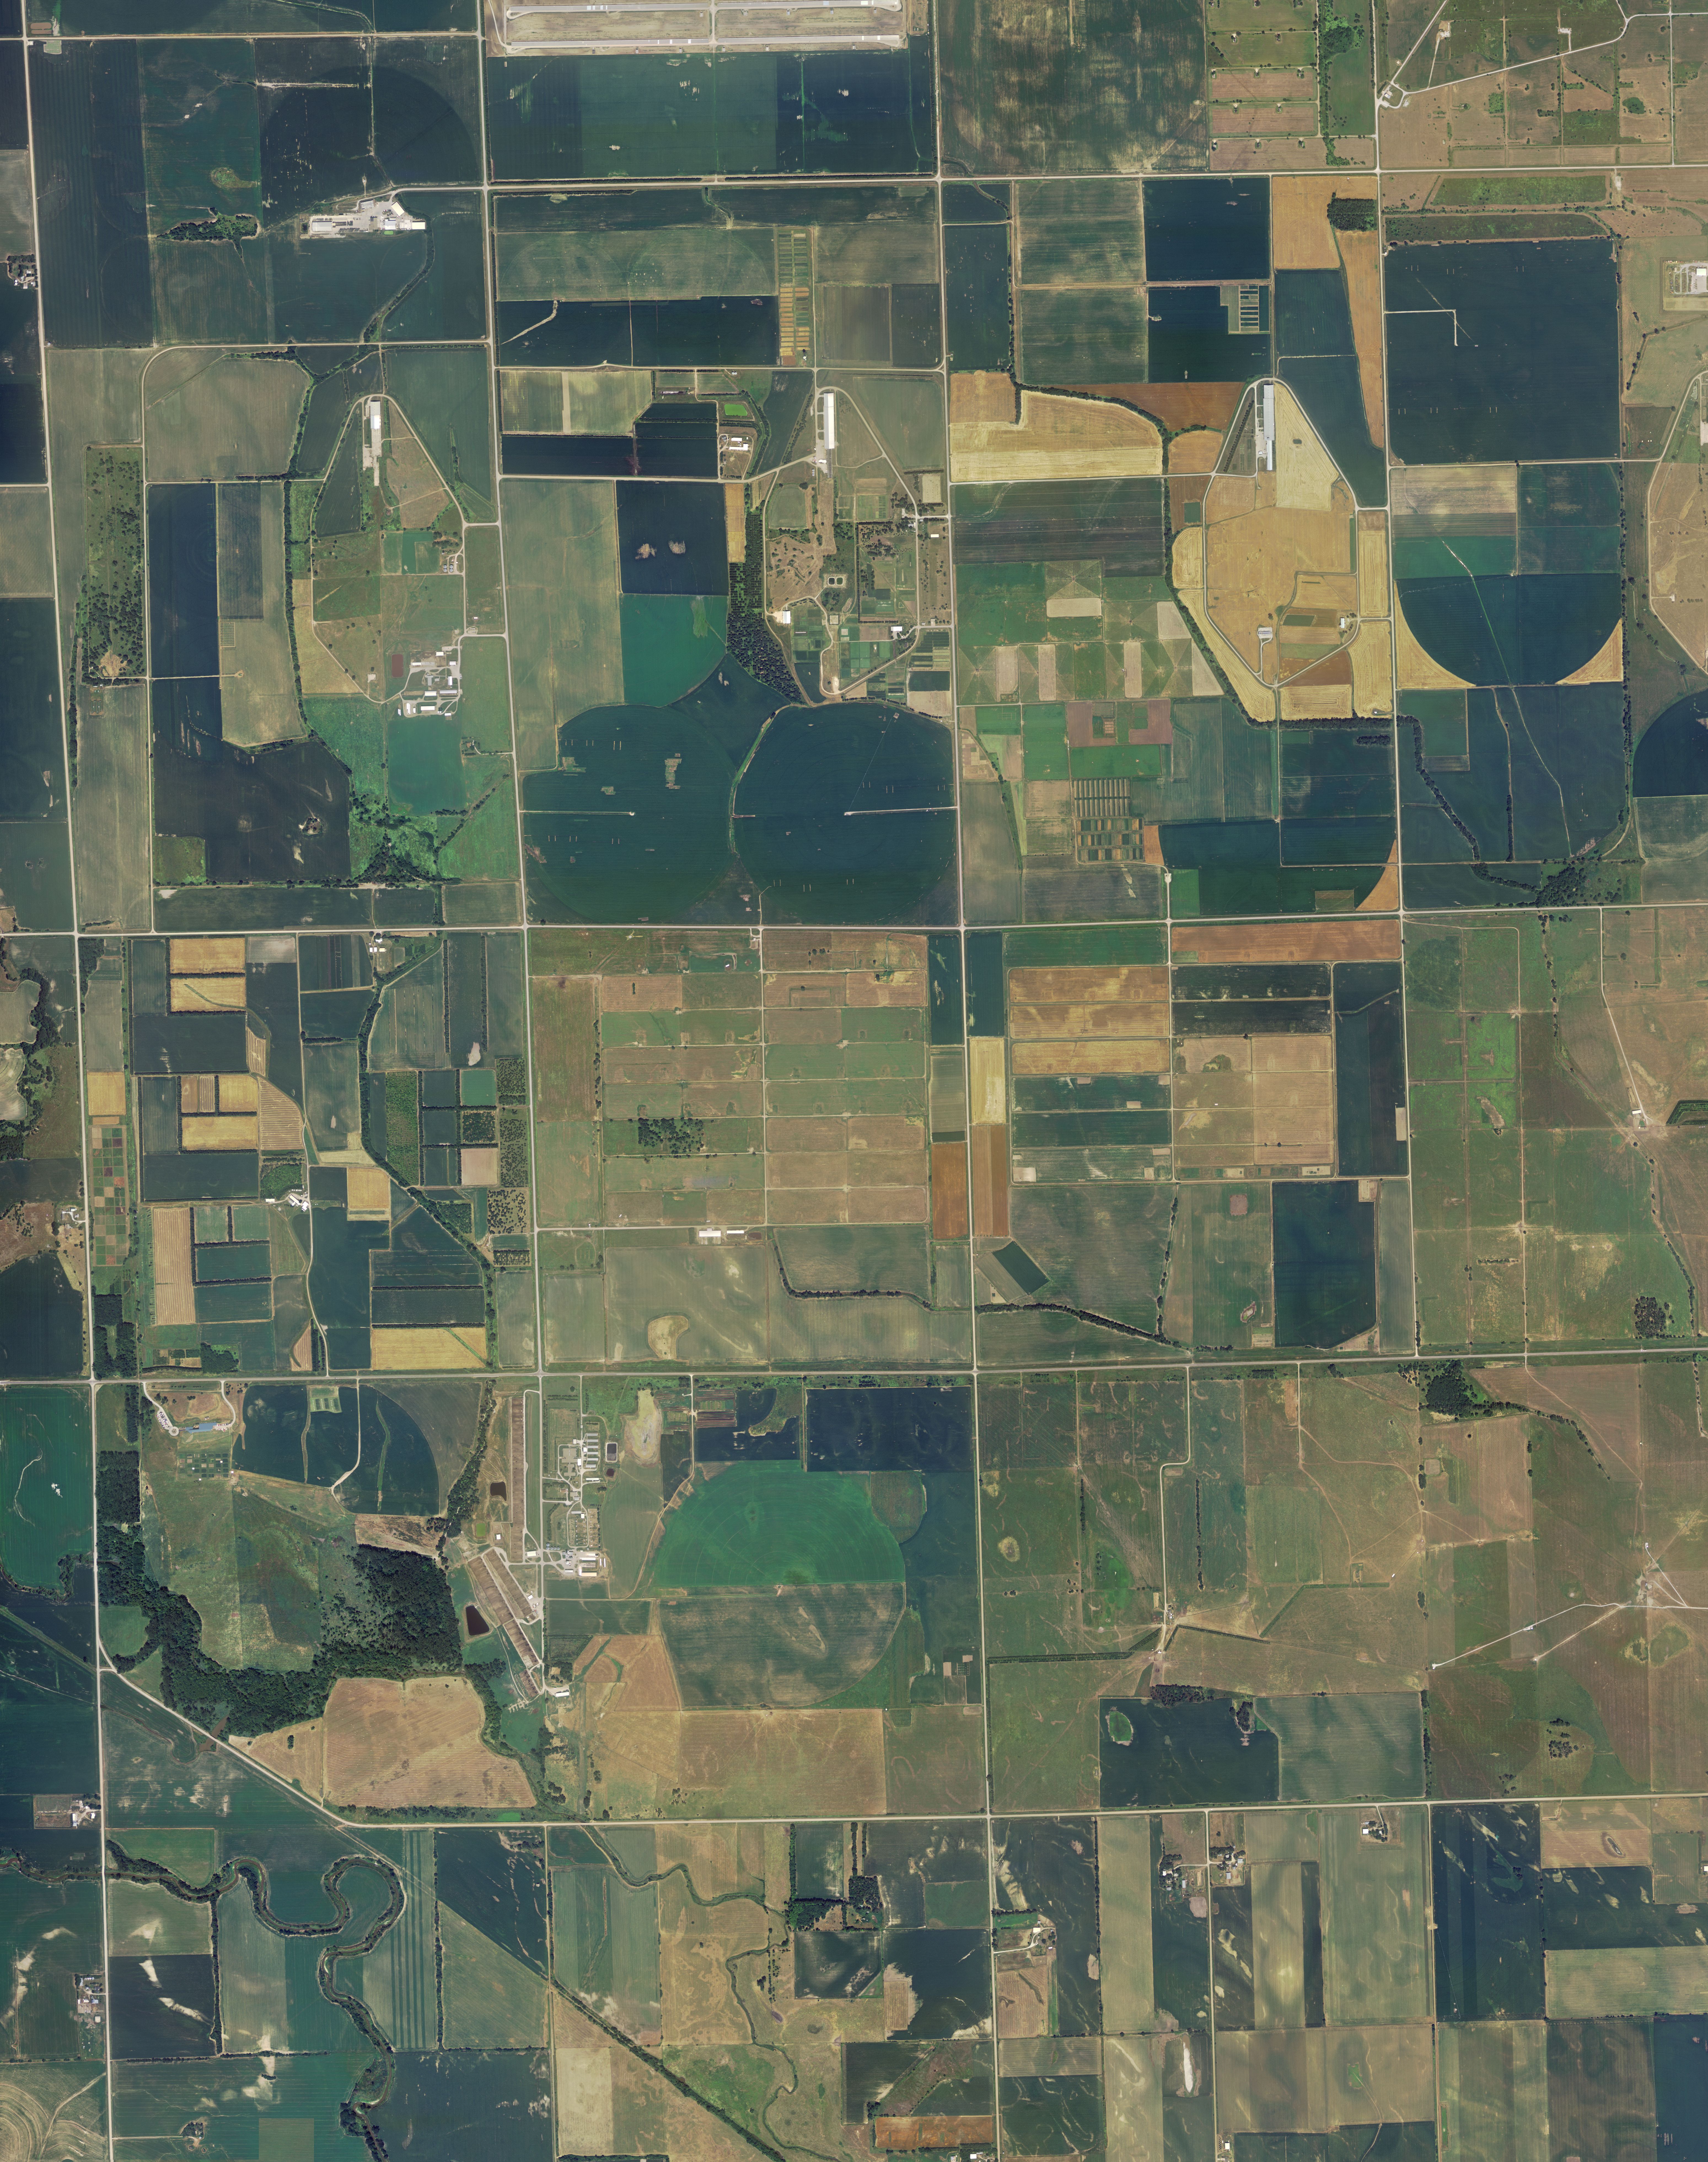
There are many data layers
available for the public to access via the Internet. These data can
give growers valuable information pertaining to spatial variability
within an agricultural field. The most popular publicly-available data
layers include: 1) digital orthophoto quads, 2) digitized soil survey
maps and 3) digital elevation models (see Lesson 1 for more details).
Frequently low-yielding areas can be recognized on an orthophoto quad
image and/or be related to different soil types and field topography.
There is no out-of-pocket expense associated with downloading these
types of data. Therefore, the data processing sequence described in
this
lesson can serve as the first step toward adoption of precision
agriculture for a given field. Signs of field anomalies and the
presence of
high spatial variability may indicate that the field is suitable for
additional exploration of the site-specific crop management approach.
Objectives
- Import various publicly available data
layers
- Generate the field boundary using an
image
- Reduce large data files to the extent
of the field
- Display field surfaces using a
three-dimensional view mode
- Georeference an image using control
points
Please e-mail vadamchuk2@unl.edu
to obtain the password allowing complete access.
Return to the
main page