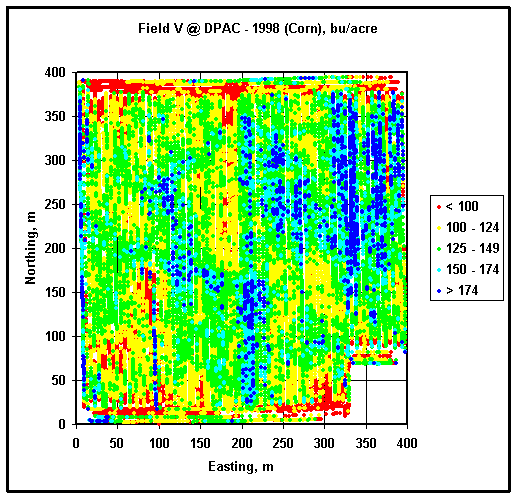
This page was designed to illustrate a way to plot yield data using a spreadsheet application. Yield mapping is one of popular precision farming practices. In this case, data files are recorded by a yield monitoring system. Along with the other parameters, each line of a data file usually contains geographic latitude and longitude, grain mass (volume) flow, speed, header (swath) width and its position (up/down), and grain moisture. Via simple computations yield (in bu/acre) can be assessed at each point. Filtered yield data can be plotted and compared to soil properties, remotely sensed image, etc. Such comparison may allow determination of a reason for existing spatial variation of yield.
Some yield monitoring systems require use of particular data processing software that automatically computes grain yield at each point. However, in order to process a set of raw yield data it is necessary to make sure that meaning of each field in the source file is known. The exercise (below) uses raw output files of AgLeader 2000 yield monitor. An example of an output lime is:
| Field | Value | Meaning |
|---|---|---|
| 1 | -85.162748 | Geographic longitude in decimal degrees (85.162748 degrees West) |
| 2 | 40.264945 | Geographic latitude in decimal degrees (40.264945 degrees North) |
| 3 | 13.61 | Grain mass flow in lb/s (13.61 lb/s) |
| 4 | 485916 | GPS time (seconds from the beginning of GPS week) (485916 s) |
| 5 | 1 | Cycle duration (always 1 s) |
| 6 | 56 | Travel speed in in/s (56 in/s) |
| 7 | 15 | Swath width in ft (15 ft) |
| 8 | 16.6 | Grain moisture (16.6 %) |
| 9 | Down | Header position (Up / Down) |
| 10 | 1 | Pass (always 1) |
| 11 | 0 | Field (always 0) |
| 12 | End Rows | Load (Bulk / NASS / End Row) |
| 13 | 1 | Load number (1) |
| 14 | Corn | Crop (Corn) |
| 15 | 2 | GPS status (2 - differential GPS) |
| 16 | 3.2 | PDOP (position dilution of precision) |
| 17 | 299 | Altitude in m (299 m) |
Note: Underlined values should be used for computations.
At first, values of grain flow and moisture have to be shifted forward in order to account for a combine lag, which depends on combine and harvested crop (in many instances is assumed to be 12 s). Shifted values shall be compared with the corresponding header position (valid data has non zero grain flow, moisture and speed, as well as down header position).
Following formula may be applied to compute yield (in bu/acre) at each point:
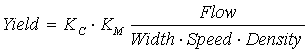
where KC is needed to account for units conversion (12 in/ft x 43560 ft2/acre), and KM should account for moisture difference:
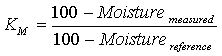
Reference moisture and corresponding density are different for different crops. Usually it is assumed that corn with 15% moisture (reference) weights 56 lb/bu, while soybeans under 13% moisture weights 60 lb/bu.
Valid values of computed yield should be filtered out from the rest data and be used along with corresponding latitude and longitude for plotting. Similarly to the plotting of a boundary, geographical position must be converted into linear units in the local coordinates. It is advised to use the same origin and conversion factor as for corresponding boundary map.
Several categories of yield shall be selected. Each category is assigned a different color. The categories should not overlap, and all valid values must be categorized. In the exercise (figure above), five corn yield categories have been established: red - below 100 bu/acre; yellow - from 100 bu/acre below 125 bu/acre; green - from 125 bu/acre below 150 bu/acre; light blue - from 150 bu/acre below 175 bu/acre; dark blue - from 175 bu/acre (boundary value goes to the next category).
Through a condition statement, easting and northing of each data point should be separated into selected categories. Then, each category is to be plotted as an independent dot graph in x-y coordinates.
You may exercise plotting yield data using following files:
web_yield_v.csv
and web_yield_r.csv
- raw comma delimited yield monitor output files from Fields V and R at
Davis-Purdue Agricultural Center (Farmland, IN)
Verify your solution using
web_yield_v.xls and
web_yield_r.xls spreadsheet files.